
This post may contain affiliate links/ads and I may earn a small commission when you click on the links/ads at no additional cost to you. As an Amazon Affiliate, I earn from qualifying purchases. Techsphinx also participates in the StationX Affiliate program. You can read my full disclaimer here.

In this post not only you’ll learn about htop command, but I will also show you practical examples and shortcuts that can help you perform day-to-day process management tasks with ease using htop.
There may be times when a process will be consuming most of the resources of your system or you want to increase/decrease the priority of a process.
There are many great tools available to monitor and manage processes on Linux.
One of such tools is htop.
What is htop command?
Htop is a terminal-based system monitoring and process-managing tool designed for Unix based operating systems. This awesome tool is written in C programming language by Hisham Muhammad.
Htop command shows a full list of processes running on the system along with visual information for processor, memory and swap status.
It is designed as an alternative to the utility called “top”. Unlike “top”, it provides a more convenient, visual, cursor-controlled interface for sending signals to processes.
This means you can perform tasks related to processes like killing or renicing from the htop dashboard with just a few clicks. Using htop you can even sort processes based on time, CPU usage, memory usage and all the processes owned by a particular user.
Htop command vs top command
As I previously mentioned, htop is designed as an alternative to top utility. So, let’s see some of the distinct features that htop provides over top.
First let’s talk about the top command:
TOP: Table of Processes
Top is a terminal-based task manager program that displays CPU and memory utilization of a Unix-like/Linux system. It is written in C language and was initially released in 1984. It is one of the most useful tools for a system administrator.
Features of Top command:
- Comes Pre-installed in many Linux based systems
- provides a dynamic real-time view of a running system
- Display UPTIME and LOAD Averages
- Show TASK and CPU States
- Display MEMORY Usage
- Display complete process-related information
Now, let’s see some awesome features of htop command:
- Do everything that TOP command does
- Beginner Friendly interface (thanks to ncurses library)
- More Customizable than Top command
- Has Mouse support
- Supports horizontal and vertical scrolling
- Easy to kill, renice or manage processes with just click of buttons.
The only major disadvantage of htop command over top command is that it doesn’t come pre-installed in Linux-based systems.
This may pose a problem for some system administrators who don’t have permission to install software on their system.
In that case you have to work with the old top command.
Install htop on Linux
You’ve seen the difference between htop command and top command, now let’s install htop command in Linux.
To install htop on Debian and Ubuntu run:
sudo apt install htop
To install htop on Centos, RedHat and Fedora run:
sudo dnf install htop
Note: You may need to configure EPEL repo for CentOS, RedHat to install htop package.
To install htop from source:
Htop installed from repositories usually doesn’t contain the latest version. To get the latest version of htop, head over to htop.dev
1. Download htop source tarball.
2. Extract the downloaded tarball using:
tar -zxvf htop.tar.gz
Replace htop.tar.gz with the file you’ve downloaded.
3. Navigate to the extracted htop directory using cd command.
cd htop
4. Run the following commands in order to compile htop:
./configure
make
sudo make install
5. Run htop command
If installed correctly, you’ll see htop command output screen.
Understanding the Htop Command Output
To use htop utility to monitor and manage system processes, just run the htop command in terminal:
htop
Now, to understand the output of htop command, let’s break it down.
Understanding CPU usage with htop
On the topmost left corner of the terminal, you will see CPU usage of your system.
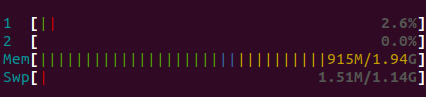
The number of bars denotes the cores of CPU. By default, htop shows CPU usage for individual cores.
Now, you may wonder what is the meaning of different color bars here.
These different color bars are percentages of the CPU used by different types of processes.

There are two modes of the CPU metrics: Default mode and Detailed mode. You can enable detailed mode in display options under htop setup menu.
Let’s look have a look at different processes these colors denote in Default mode:
Blue: low priority processes (nice > 0)
Green: Processes owned by Normal users
Red: System processes (kernel, iowait, irqs)
Orange: virt time (steal time + guest time)
Now let see different colors and their meanings in Detailed mode:
Blue: Low priority processes. (nice > 0)
Green: Processes owned by Normal users.
Red: System processes (kernel).
Orange: IRQ time.
Magenta: Soft IRQ time.
Grey: IO Wait time.
Cyan: Steal time.
With these different color bars, you can easily know what type of processes are using up your CPU.
Understanding Memory Usage with htop
Right below the CPU usage is the memory usage of your system.
Again, different colors denote different percentages of RAM consumed.
Explanation of different colors of RAM consumption in Htop command:
Green: Displays percentage of RAM consumed by memory pages
Blue: Displays percentage of RAM consumed by buffer pages
Orange: Displays percentage of RAM consumed by cache pages
Below the memory usage you will see the swap usage of your system.
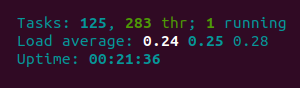
Tasks, Threads, Running Processes, Load Average and Uptime in htop
On the top-right corner of htop command screen, you’ll find info related to Tasks, Threads, Running Processes, Load Average and System Uptime.
Let’s break down each one of them to understand clearly:
Tasks: The number of open processes running on a system, in the above image 125 tasks are present.
Thr: Thr represents the threads. The above tasks are broken down into threads, in this case, 283.
Running Processes: Processes that are in “running state”, in the above image 1 process is in running state.
You may be wondering what about the other processes? Aren’t they running?
There are multiple states in which a process resides.
States of Processes:
- R: Running – Refers to the processes that are actively using CPU.
- T/S: Traced/Stopped – Refers to the processes that are currently in stopped or paused state.
- Z: Zombie or defunct – Refers to the process that has completed execution (via the exit system call) but still has an entry in the process table.
- S: Sleeping – This is the common state for many processes. Majority of the processes are in the sleep state for most of the time and perform small checks at a constant interval of time, or wait for user input before they come back to running state.
- D: Disk Sleep – It refers to a process in an uninterruptible sleep state that is waiting for I/O. Uninterruptable sleep means you cannot kill these processes, even with SIGKILL or kill -9. The only option is to reboot the system or wait for the I/O response.
Load Average: Average load of the system. Load average contains three values:
The first value (0.24) represents the average load of the system for the last 1 minute.
Second value (0.25) represents the average load for last 5 minutes.
Third value (0.28) represents the average load for last 15 minutes.
Uptime: It refers to the system’s uptime since last reboot.
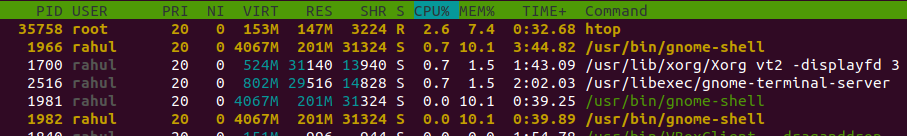
Detailed Processes Information in htop
The majority of the htop command screen consists of the detailed process information.
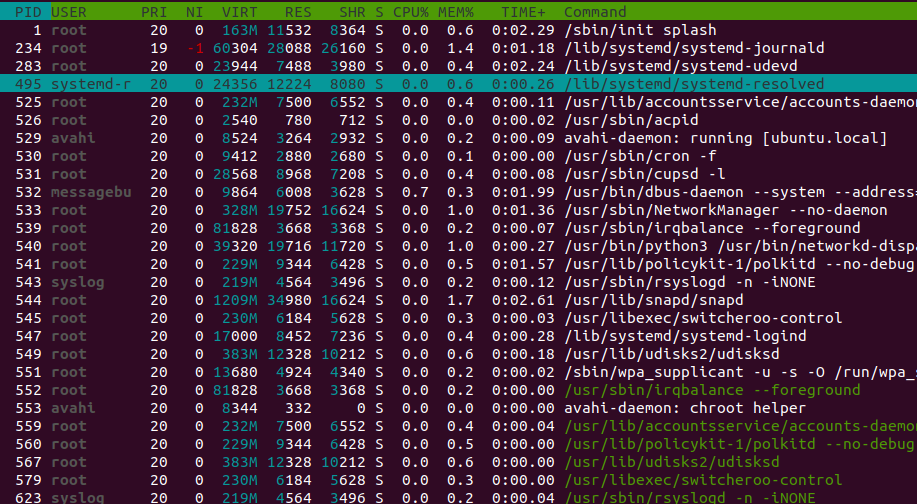
Let’s have a look at what each column represents for a given process:
PID – Process ID number.
USER – Process owner.
PRI – Process priority as viewed by the Linux kernel.
NI – Process priority reset by the user or root.
VIRT – Virtual memory that a process is consuming.
RES – Physical memory that a process is consuming.
SHR – Shared memory that a process is consuming.
S – Current state of a process.
CPU% – Percentage of CPU consumed by each process.
MEM% – Percentage of Memory consumed by each process.
TIME+ – Time since process execution has started.
Command – Displays the full command execution in parallel to each process.
These are the default columns present in htop command output. There are more than 30 columns available. You can show/hide columns from the setup menu of htop.
Menu Keys & Shortcuts in htop
The last bottom part of the htop command output consists of htop menu commands. This ranges from F1 to F10.

If you hate using Function keys for accessing menu (just like me), then there are also character shortcut keys for each of the function keys mentioned above.
These character shortcuts are highly useful if you are working with an SSH client like putty where the function keys are mapped for a different purpose.
Have a look at the table below for all the shortcut character keys for invoking menu items in htop.
Note: Shortcut keys in htop command are Case-Sensitive.
| Function Key | Description | Character Key |
| F1 | Htop Help | h |
| F2 | Htop Setup Menu | S |
| F3 | Search for Process | / |
| F4 | Invert Sort Order | I |
| F5 | Tree View | t |
| F6 | Sort By Column | > |
| F7 | Nice – (Change priority) | [ |
| F8 | Nice + (Change Priority) | ] |
| F9 | Kill Process | k |
| F10 | Quit Htop | q |
These are the shortcut keys for invoking menu items, further down the post, I have mentioned other shortcut keys in htop that’ll ease your day-to-day tasks.

Customize Htop Command Output
The output of Htop command is highly customizable.
Here I present some of the options that will help you to customize the output according to your needs.
Htop Setup Menu
You can do the majority of the customizations of the htop command output from the htop setup menu.
To access the setup menu, press F2 or S (S is case-sensitive).
There are 4 major categories that will help you to customize your htop command output.
1. Meters: Customize the look and behaviour of meters.
(Further down the post we will be customizing the CPU meter to display CPU Averages)
2. Display Options: Options to show, hide and highlight certain things in the output.
3. Colors: Change color theme of the htop command output.
4. Columns: Show or hide columns in the output. This option helps to de-clutter the output and helps to focus on the things that really matter to you.
Display CPU Averages in htop command output
As previously mentioned, you can see CPU usage of your system in the top-left.
But there is a catch, htop shows CPU usage for individual cores. If you want to get the average CPU usage of all the cores, then follow the steps below:
1. Press F2 or S to open setup menu in htop.
2. Select Meters tab
3. Use right arrows to navigate to “Available Meters” Column
4. Now, use down arrow key till you find “CPU average” meter.
5. Hit enter key to select that meter.
6. Now, you’ll notice “CPU [Bar]” is added to one of the columns.
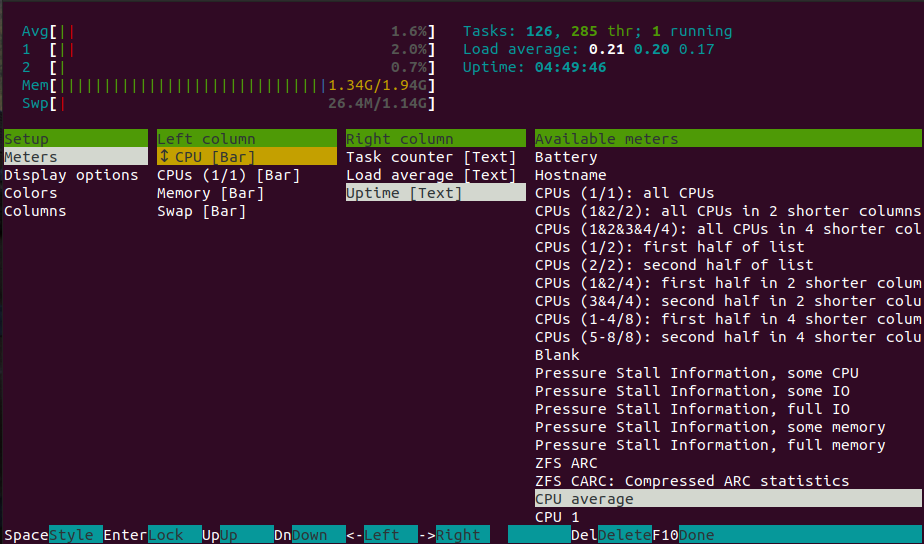
7. Use the arrow keys to position it to your desired location.
(I prefer it at the top-left of the screen.)
8. Hit F10 or q key when done.
If you don’t want to display CPU usage for individual cores, then go to setup menu again and select the “CPU (1/1) [bar]” meter and hit delete key.
Change the Output Refresh Interval
If you want to set a custom output refresh interval, then start htop command with the delay option.
htop -d 10
-d: delay
10: Time to delay in tenths of a second.
Using htop command for day-to-day tasks
Let see some practical examples of htop command that can help you with your day-to-day tasks.
Scroll Process List Horizontally and Vertically
In htop you can scroll both horizontally and vertically.
Use ‘Up and Down’ Arrow keys to scroll the processes vertically in htop.
Use “Left and Right” Arrow keys to scroll the processes horizontally in htop. This is useful if you have added more columns in the output.
You can also use “Page Up” and “Page Down” keys to scroll the processes.
Kill process using htop
You can kill a process without leaving htop command.
To kill a process first select that process (using arrow keys), then press “F9” or “k” which will display the send signal menu that lists all the signals that you can send to a process.
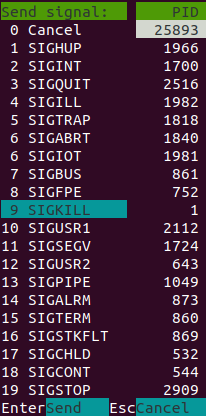
You can choose “SIGKILL” option to do a “kill -9” on the selected process and press enter key.

Renicing processes within htop command
You can easily change the nice value of a process within the htop utility.
Just select the process and:
Use “F7 or [” key to decrease the nice value of a process.
Use “F8 or ]” key to increase the nice value of a process.
Sorting Processes in htop
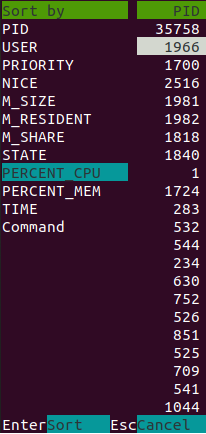
By default, htop is set to sort processes based on CPU consumption.
If you want to change that default sorting order, then hit “F6” or “>” and choose any column you want to sort by and press enter.
Here are some commonly used shortcut keys that will help you with sorting processes.
u – To display all processes owned by a particular user.
P – To sort processes on the basis of high CPU consumption.
M – To sort processes on the basis of high Memory consumption.
T – To sort the processes on the basis of the time period.
Display Processes in Tree View
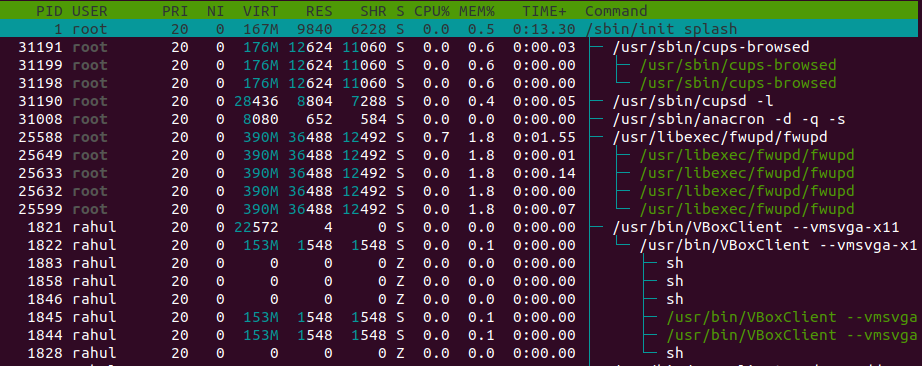
A tree view can help you to determine all the dependencies of a process.
F5 or t: Use “F5 or t” key to display all the related processes in a tree view.
Use “+” and “–” key to expand and collapse a process tree.
Follow a Process in htop command Output
In htop, a process will always keep changing position based on CPU% (by default).
If you want to monitor a particular process, then it will be hard to view a particular process across the entire screen because of the continuous changing of positions.
F: Using ‘F’ key you can follow a particular process. The process will remain highlighted when changing positions.
Strace a Process from htop
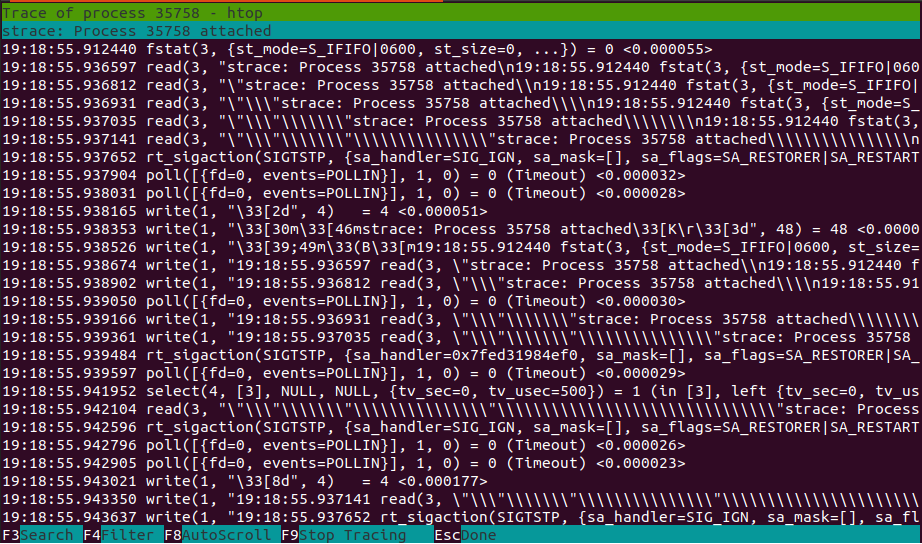
Strace is a great tool for debugging programs in Linux-based systems. It captures and records all signals received and system calls made by a process.
s: Use the ‘s’ key to strace a process without quitting htop command.
Display lsof output inside htop
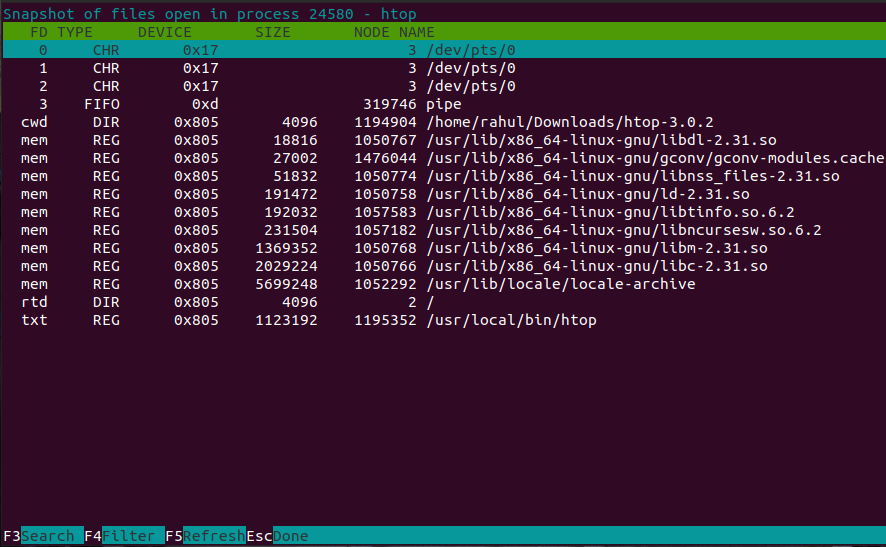
Wouldn’t it be nice to get the list of all the open files owned by a process?
Surely, you can run “lsof” command for the same.
There is also a way to list open files of a process using “lsof” without leaving htop command.
l: Use the “l” key to list all the open files owned by a particular process.
Kill Multiple Processes using Tag
In htop you can group multiple processes by tagging them.
If you need to kill multiple processes at once, you can tag all the required processes using “space bar”. Tagged process/es will be highlighted by a different color.
After tagging, press “F9” or “k” key to open the kill menu and kill all the tagged processes at once.
To untag a process, press “space bar” again on the tagged process. If you want to untag all the tagged processes, then press the “U” key.
Getting Help related to htop command
There are many other options, customizations and shortcuts available in htop that are not covered in this post. I have only covered the most basic options used by most people.
If you have a particular use-case related to htop, then checkout the help option and man pages for the same.
F1 or h – ‘F1’ or ‘h’ key is used to open the help window and to see more shortcuts that are not mentioned in this post.
Conclusion
Htop is a great tool for managing and monitoring processes on Linux based systems.
It has a beginner friendly and customizable interface.
And most of all it’s easy to use.
So, what tool you use for process monitoring on Linux?
Tell me in the comments.
Also, share this post with your friends and colleagues and let them know of this great tool.

If you like this post, then follow Techsphinx on Facebook and Twitter for more reviews, tricks, tips and tutorials.
This article needs update or correction? Report the issue here so I can update it.